V. THE RISE OF RAAS
A Liquid Labor Valuation Framework
I. The RaaS Model: What is “New”?
In the RaaS model, the offering is not merely a financial lease; it is a Capacity Guarantee. The client pays for labor hours, not metal.
The Old Model (CapEx)
Under the old model, the buyer acquires a robot; if it breaks, productivity is lost and the buyer bears the liability.
The RaaS Model (OpEx)
Under RaaS, the client buys “Industrial Continuity”—paying for labor hours, not metal.
- Adaptive Supply: Deploy and scale units based on workload needs; swap units in the field as needed. This is Liquid Labor in practice: the labor force expands and contracts dynamically with the project scope.
- The Innovation: The “new” aspect is the shift from selling tools to selling outcomes (hours of skilled work). This decouples the client’s risk from the hardware’s complexity.
II. Adapting the NAWI Model to RaaS
In the Liquid Labor essays, NAWI stands for the National Autonomous Work Index. It is a macro-economic metric measuring the “Time Bank” of a nation—the total productive hours generated by machines.
The Formula (Macro)
Variable definitions:
- NAWIt (National Autonomous Work Index): The aggregate metric representing a nation’s total machine labor capacity at a specific time (t). It translates various forms of automation into a standardized “full-time equivalent” work-hour contribution to the national economy.
- Ni,t (Robot Stock): The total number of operational robots or autonomous units of a specific type (i) available in the workforce at time t.
- hi,t (Utilization Hours): The average number of hours per year that each robot of type i is actively utilized for productive tasks.
- φi,t (Task Substitution Factor): A coefficient reflecting the technical effectiveness of the robot compared to a human worker. Values typically range from 0.5 (for specialized, limited-task bots like warehouse arms) to 1.0 (for advanced, general-purpose humanoids capable of full human-task parity).
- i (Type Index): Represents the specific category or class of automation being measured (e.g., software agents, industrial robots, or humanoid platforms).
- n (Total Categories): The total number of different types of autonomous systems included in the national aggregation.
- t (Time): The specific year or period for which the index is being calculated.
The Adaptation (Micro – The “RaaS Contract”)
We adapt NAWI from a national metric to a Client-Specific Capacity Metric. When a shipyard signs a RaaS contract with a provider, they are not renting robots; they are purchasing a NAWI Future—a stream of guaranteed productive hours.
FleetSize (N): Adaptive. If a shipyard requires 50 welders for a surge, N adjusts to 50; if 10 are needed for maintenance, N drops to 10. Uptime (h): Guaranteed by the RaaS provider. The model incentivizes the provider to maximize h, because any downtime results in lost revenue. SkillRating (φ): Improves over time via software updates; the robot becomes a more effective worker (e.g., φ may rise from 0.8 to 1.5 of a human equivalent).
III. The “Liquid Labor” Valuation Framework for Automated Work
This framework generalizes the economic logic of RaaS. It is designed for any business evaluating the transition from human labor to automated labor. The core metric is not just “cost savings” but Energy Return on Investment (EROI)—treating capital as energy and automation as an efficiency engine.
Phase I: The Unit Economics (The “Atomic” Level)
Before valuing the company, we must value the Single Unit of Automation. Does one robot generate more value than it consumes?
Variables:
- Rrate: The hourly rate charged to the client (revenue per hour).
- Cbuild: The cost to manufacture one unit (Bill of Materials + Assembly).
- Cops: The hourly cost to operate (electricity + maintenance + teleoperation).
- U: Utilization rate (hours worked per year).
- L: Useful lifespan of the unit (in years).
1. The Energy Break-Even Point (Time)
This metric indicates how long the robot must work before it has “paid back” the energy (and capital) embodied in its creation.
Goal: Tbreak-even < 1.0 (less than 1 year). If the robot takes 3 years to pay for itself, the technology is likely too immature or expensive.
2. The Lifetime Value Multiplier (LVM)
A deeper measure of efficiency: for every $1 of capital put in, how many dollars of work are yielded?
Benchmarks:
- LVM < 1.0: Parasitic. The robot consumes more wealth than it creates.
- LVM = 1.0: Neutral. No economic gain.
- LVM > 3.0: Investable.
- LVM > 5.0: Transformative. (Targets in this range are often cited in prior analysis.)
Phase II: The Client Value Proposition (The “Arbitrage”)
Why would a client hire a robot? Quantify the Labor Arbitrage—the gap between human cost and robot cost.
Variables:
- Hcost: Total cost of a human worker per hour (wages + benefits + insurance + liability).
- φ (phi): The Productivity Coefficient—how fast the robot is compared to a human (1.0 = equal productivity).
3. The Client’s Net Benefit
The Sales Pitch: If Benefitclient > 0, the client is “printing money” by switching to the automated solution. The “Liquid Labor” Constraint: In heavy industry (4D jobs: dull, dirty, dangerous, declining), Hcost is extremely high due to danger and scarcity. This allows the provider to charge a high Rrate while the client still achieves significant savings.
Phase III: The Scalability & Valuation Model (The “Fleet”)
Valuing the entire business means projecting the growth of the fleet and accounting for the compound effect of software improvements.
Variables: Nt = fleet size in year t; Ssoft = Software Improvement Factor (year-over-year efficiency gain); Churn = rate at which clients cancel.
4. The RaaS Liquidity Ratio (RLR)
A crucial health check for the business model: the ratio of recurring revenue to the energy cost of maintaining the fleet.
Interpretation: If RLR is high (e.g., > 5.0), the company has high margins to fund R&D and expansion. If RLR is low (< 2.0), the company is fragile—a small increase in energy prices or maintenance costs could lead to bankruptcy.
5. The Generalized Valuation Equation
The Net Present Value (NPV) of the total work capacity of the automation provider’s future fleet, adjusted for software improvements:
Unlike selling hardware (one-time revenue), RaaS valuation compounds: (1 + Ssoft)t means the same robot becomes more valuable over time via software updates.
Why should a business care? The Break-Even Point (BEP)
Total cost (fixed + variable) meets income at the BEP. Below this point, the provider operates at a loss; above it, the “National Time Dividend” begins to accrue. In high-efficiency sectors like shipyard welding, the ROI is often achieved within one to two years due to the massive reduction in hourly labor costs ($8/hour for robots vs. $25/hour for humans).
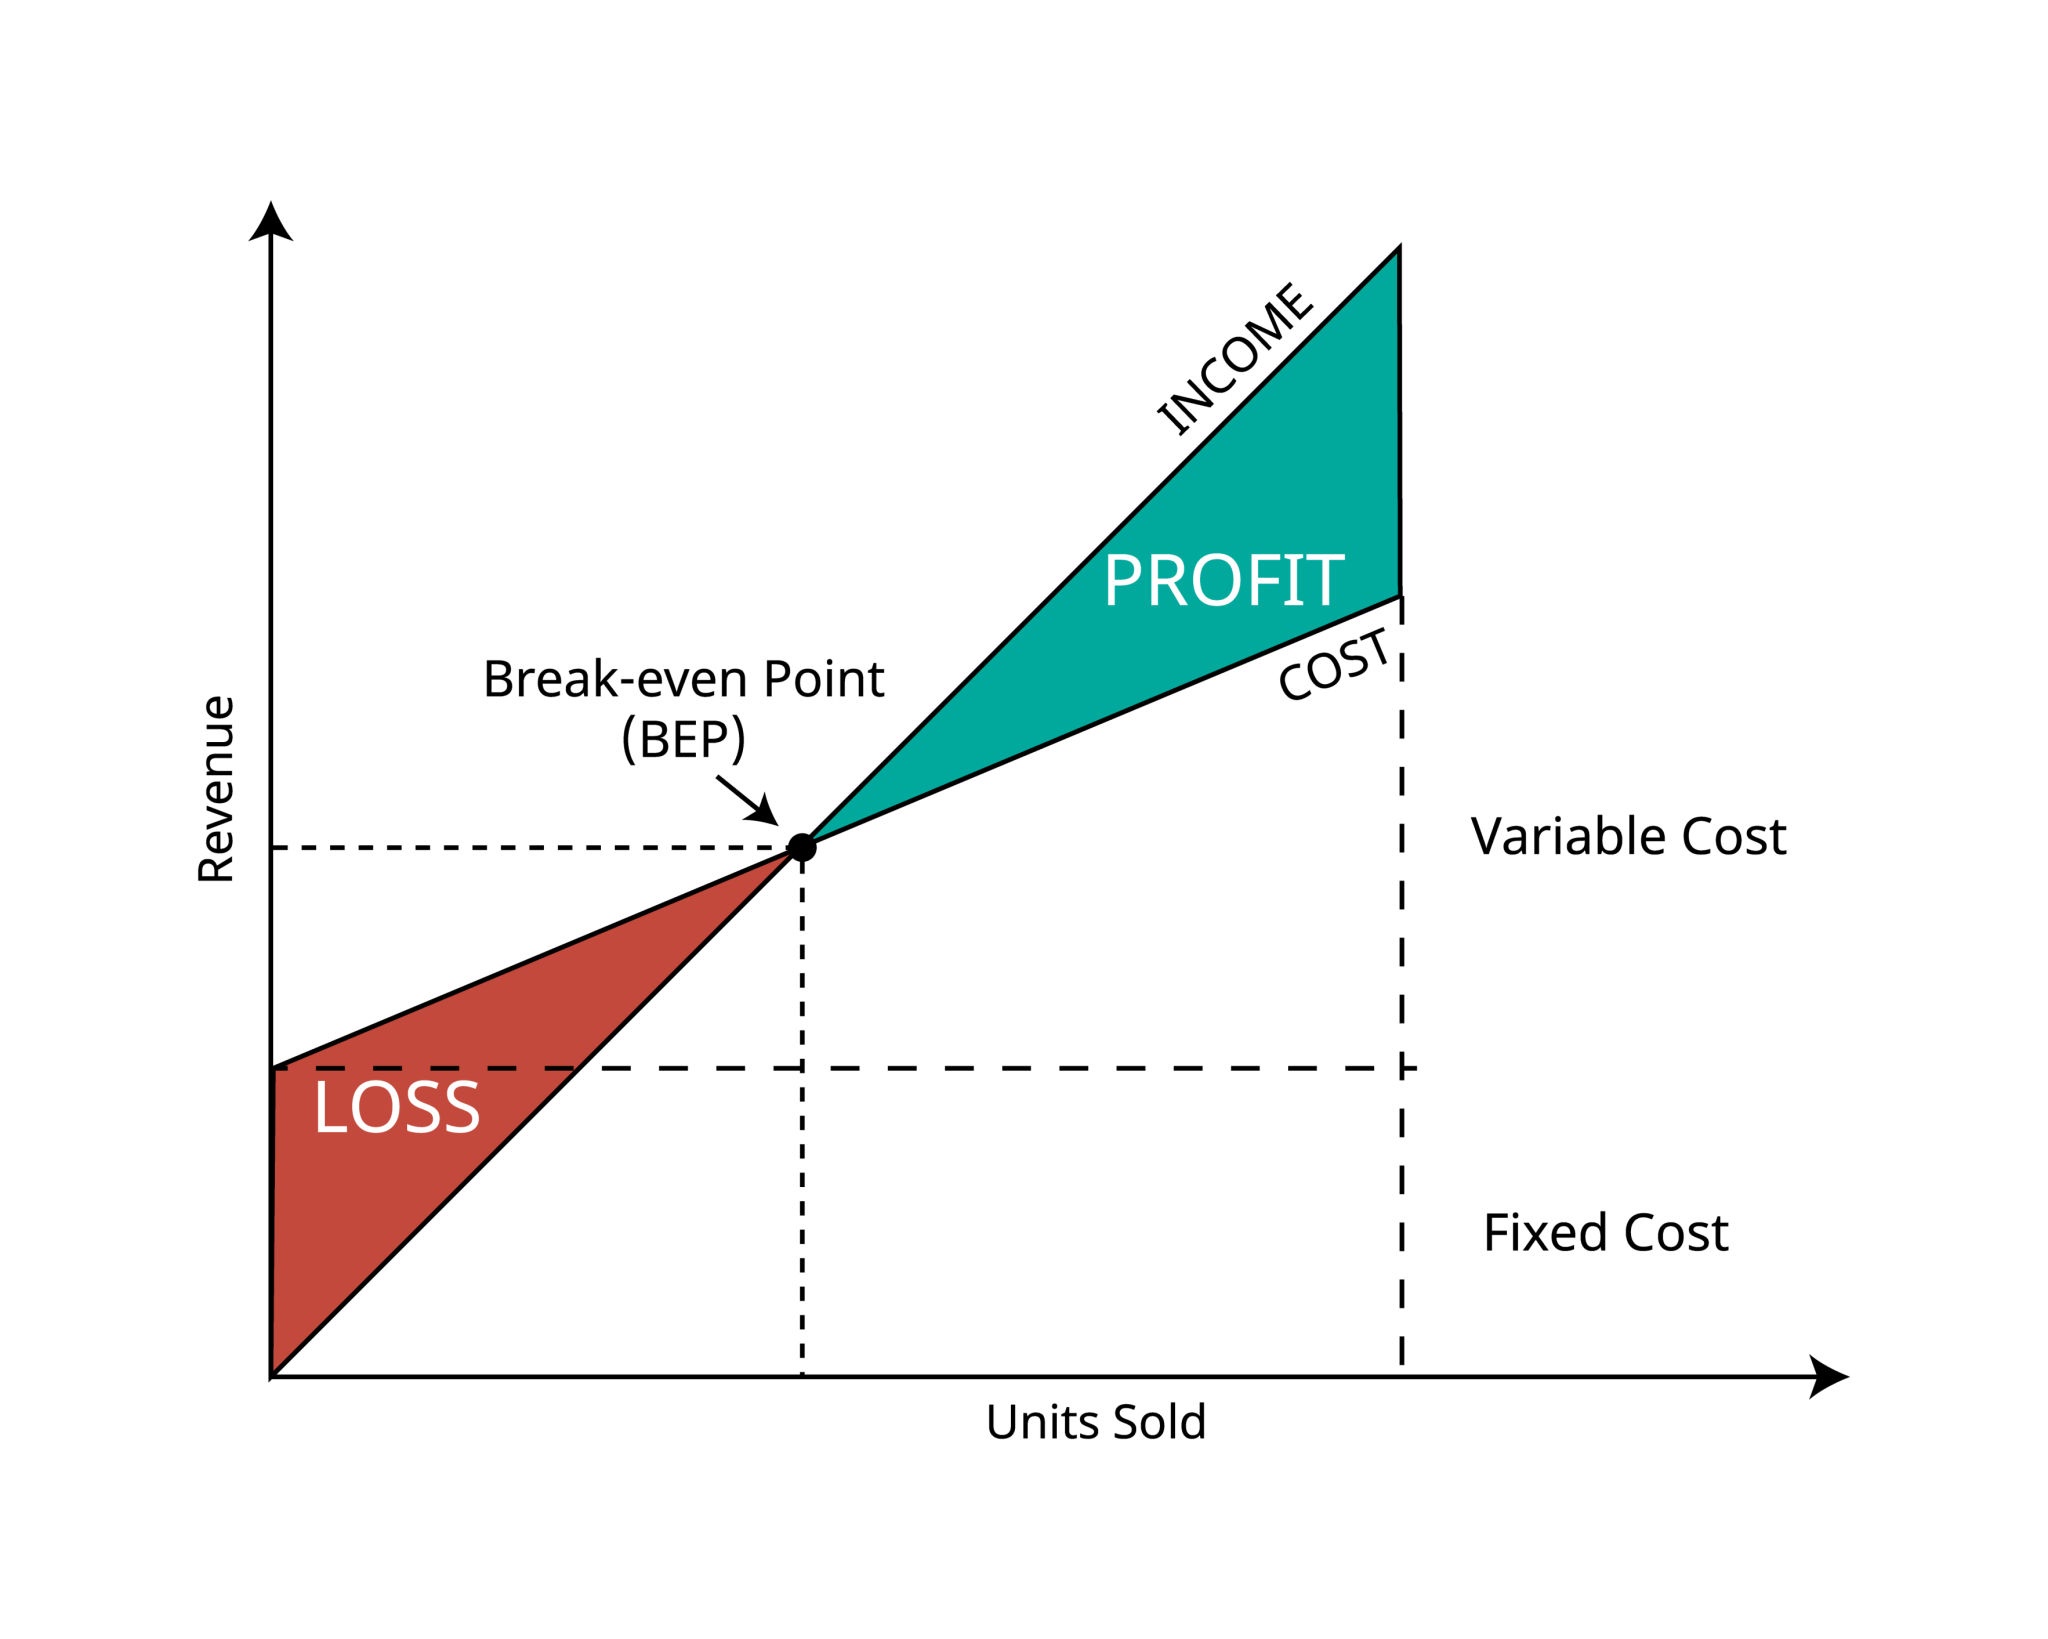
Source: Schematic for RaaS economics. Why it matters: Break-even (fixed + variable cost = income) defines viability; below it the provider operates at a loss, above it at a profit—core to the investor checklist (Tbreak-even, RLR, φ).
Summary Checklist for the Investor
To determine if an automation business is viable using this framework, ask:
- Is Tbreak-even < 12 months? (Is the hardware cheap enough?)
- Is RLR > 4.0? (Is the operational cost low enough?)
- Is φ increasing? (Is the software team actually improving the robot’s speed?)
- Is the market “Liquid”? (Is there a labor shortage high enough to guarantee demand?)
Guided Demand Constraints
An “Entropy Tax” can guide demand by modifying client cost based on the robot’s application:
If the client uses the robot for “hedonistic” ends (e.g., mass-producing trivial goods), cost is marked up. If for “Architect” ends (e.g., shipbuilding, fusion, moon base), cost is subsidized.
Conclusion
The RaaS framework naturally favors “Architect” applications due to higher energy ROI in heavy industry. Market forces—particularly labor shortage—act as a natural Entropy Tax, pushing liquid labor toward hard challenges (shipbuilding, energy, infrastructure) as the theory intends, without requiring immediate government intervention. In short, RaaS operationalizes the Liquid Labor valuation framework: robotic work-hours become a measurable, tradable asset, and the equations above give them a formal structure.